Assignment #10

This chapter of Poor Economics a host of statistics are employed to evaluate the use of microcredit. In particular this chapter examines the regions of Kabul and India and sees how microcredit affects the issue of poverty.

The first and most pertinent statistic that this chapter examines is the difficulties that the poor face when it comes to lending. Many banks refuse to lend to the poor, so it enables moneylenders to offer high interest rates to the poor. This creates a lot of problem for the poor people because the only kind of lending that they can engage in has extremely high interest rates. These high interest rates make it hard for the people to pay off, potentially making these people even poorer. The power that the moneylenders have illustrates a form of exploitation of the needs of the poor. It also reveals how there ought to be some sort of system in place in which the poor can obtain low-interest rate loans.

I learned much about the loan structure in other countries from reading this chapter. I myself am not very familiar with the loan system and what good rates would be, but it is evident that some of these rates that moneylenders offer are very high. This is something that needs to be corrected not only in other countries but also in America. The exploitation of the poor is something that needs to be corrected if we truly want to help them improve their financial situation.

Assignment #9

This article investigates the non-linear causality of tax burdens on personal income and corporate income to GDP growth per capita.  It examines the period 1948 to 2008 and employs the tax revenues GDP data observed in these years to act as the basis for the non-linear causality tests.

This paper helped me to gain supporting data for my expected results and provided a source of credibility to my regression results. This article did not suggest any issues that I have regarding the assumptions of the classic linear model. 

Tax Burden Distribution and GDP Growth

Regression Assignment

Image

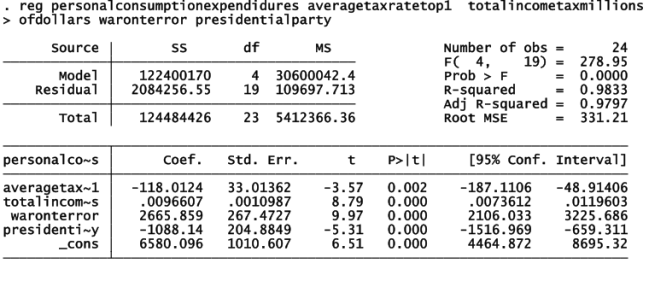
When I started my experiment I wanted to show that there is a strong negative correlation between GDP and income tax rates on the top 1% of Americans. As a result I decided to test one of the major components of GDP, consumption, and its relationship with income tax rates on the top 1% of Americans. The principle relationship of interest in this regression is the correlation between personal consumption expenditures and the average tax rate of the top 1% of Americans. After running the regression, the coefficient shows that there is a relatively strong negative relationship between the average tax rate of the top 1% of Americans and personal consumption expenditures. This means that as the income tax rate on the top 1% of individuals decreases, the personal consumption expenditures will increase. As a whole, all of the T-stats are high meaning that we can reject the null hypothesis, H0:0, at every confidence level. The R-square value is .9833, which is very close to 1, and additionally the F-stat is very high so we know that this R-square value is reliable. Looking forward, I would like to add a few more proxy variables to see how accurate the correlation is when different factors are incorporated into the regression.

Assignment #7

Chapter four in Poor Economics illustrates some of the issues that surround education in developing countries. Attendance rates, of both children and teachers, have declined and the overall education level has also fallen. A statistic found in the chapter that best illustrates this is “Overall, 50 percent of teachers in Indian public schools are not in front of a class at a time they should be.” One of the big issues surrounding the chapter is the debate between parents and the government over finding a balance of kids’ academic success and government funding for better teacher training and resources.


An interesting article that I found was The Achievement Gap: Coming to a Theater Near You. This article shows how poor and colored children in Minnesota are falling behind in school. The most shocking statistic from this article was “Minnesota has the nation’s lowest on-time graduation rates for Hispanic and American Indian students, according to the U.S. Department of Education.” This article is similar to the chapter as it illustrates how poverty and cultural influences can influence the education that children receive. The cultural beliefs and financial situations surrounding the environments in both the chapter and the article are proven to affect the quality of education that people are receiving.


Where these passages differ is in how they are presented. The article presents the issue and then briefly goes into how the public awareness campaign will go about addressing this issue and highlighting the significance of this issue. The chapter on the other hand presents statistics in a logical way that helps convey the reader about the author’s central thesis about the chapter. 

The achievement gap: Coming to a theater near you

Assignment #6

For years, politicians and economists alike have argued over the topic of income tax rates and their affect on national GDP. Perhaps the most debated about group are the wealthiest 1% of Americans, as they alone accounted for just under twenty percent of the United States’ annual income. The positions taken on what ought to be done about the tax rates on these individuals couldn’t be much different from one another. On one side you have people who believe that they should have their income tax rates raised in order to accumulate more tax-revenue, while the other side, supply side, calls on the observed success of Ronald Reagan’s income tax cuts that resulted in a period economic prosperity for the United States. Despite all the debate and historical evidence available, no one has really been able to answer the question, how do the income tax rates on the wealthiest 1% of individuals affect national GDP? 


Bibliography 

“History of The Income Tax in the United States.” Infoplease. Infoplease, Web. 1 Feb. 2013.

“SOI Tax Stats – Individual Statistical Tables by Tax Rate and Income Percentile.”IRS.gov. Web. 1 Feb. 2013

“The Presidents of the USA – EnchantedLearning.com.” The Presidents of the USA – EnchantedLearning.com. Web. 30 Jan. 2013.


Assignment #5

Many young people fall victim to the trap that is drug dealing. They enter at low positions in the hope of one day making the big salaries that the top individuals make. The glamour that they envision being associated with drug dealing often blinds them from the cruel realities that go along with the job. 

 In this chapter, we learn of the other side of drug dealing, the less glamorous side, and see how it relates to a modern day business. They show the different hierarchical levels and explain that as you go down the hierarchical ladder, the incomes starts to decrease. The “foot soldiers”, as they’re called, are the ones doing most of the dirty work, ensuring that the drugs are being sold. The low pay and the economic situation that surrounds them, causes these drug dealers to live with their moms for most of their lives. Below are some statistics from the text that help to illustrate the author’s central thesis of the chapter.

 1) Glamour of being a drug dealer – (Page 99) “At $8,500 per month, J.T’s annual salary was about $100,000” Many young kids hear about salaries like this being made by drug dealers, so they are naturally attracted to it. What they don’t know, is that the process leading up to being a top guy involves low wage and very high risk.

2) Actual income of Officers and foot soldiers – (Page 100) “So J.T. paid his employees $9,500, a combined monthly salary that was only $1000 more than his own salary… the foot soldiers earned just $3.30 an hour, less than the minimum wage,” This statistic builds off the previous one. The head drug dealer makes a large sum of money, while his workers make a fraction of it. This is even more shocking when you consider the foot soldiers are the ones selling most of the drugs.

3) Risk involved with being a foot soldier – (Page 101) “A 1-in-4 chance of being killed!” Not only do you get paid less than minimum wage, you are literally putting your life on the line every time you decide to deal drugs on the street. This shows that many foot soldiers will die before even coming close to achieving the status of even an officer.

4) Contributing economic conditions – (Page 102) ““Fifty-six percent of the neighborhood’s children lived below the poverty line… Fewer than 5 percent of the neighborhood’s adults had a college degree; barely one in three adult men worked at all. The neighborhood’s median income was about $15,000 a year, well less than half the U.S average” These young people are exposed to an environment that doesn’t promote growth or development. This statistic shows that many people were born into families that aren’t wealthy and that don’t appear to be pursuing a way out of their economic situation. They don’t know of any other lifestyles other than the ones inside their neighborhoods, and the most prominent of these lifestyles is perceived to be drug dealing.

Assignment #4

Throughout my childhood my political views have been skewed by my supply-side enthused grandfather. He was a huge supporter of former President, Ronald Regan and even served on his board of advisors for certain issues. His views on economics were very centralized on the importance of income tax cuts for the upper and middle classes. This central belief calls on the idea that with more money individuals will be more willing and able to invest money, which in theory will stimulate both money flow and the country’s economy as a whole.

Having grown up believing what my grandfather had told me about markets and how income tax rates affect the nation’s GDP, I wanted to test out the theory for myself. I gathered data from the IRS and BEA regarding income tax rates in individual years, GDP growth from year to year, and changes in investment from year to year. With this information I hope to prove that increasing the income tax on the top 1% of Americans will result in a lower national GDP as opposed to if they lowered tax rates on these individuals.

By analyzing the data I expect to find that there is a negative correlation between income tax rates and national GDP growth. This entails that as income tax rates decrease, the national GDP will grow at a higher rate.

Another area I will closely examine will be the relationship between income tax rates and investment. Many people feel that if taxed less, people will just save the excess money instead of investing it into more units of goods and services. In the supply-side view, with more money available to them, people will be tend to buy more things, thus stimulating the nation’s economy. 

I am excited to look further into my data and see what trends are there so I can better evaluate if and how income tax rates on the top 1% of individuals actually affects the national GDP.

Assignment #3

In the Slate article Shafir and Mullainathan discuss how scarcity can affect a person’s decision making. They do so by examining the game Feud. Contestants were able to borrow time in the early rounds in exchange for time that they would normally be allocated in future rounds. Shafir and Mullainathan found that the “time-poor” would borrow time in the early rounds as they felt their overall score would benefit, but as the game progressed they greatly struggled in the later, shorter rounds.

They then go on to explain that “it’s the stresses of poverty that lead to bad financial decision-making in the first place.” This plays well into the poverty trap concept addressed in Poor Economics. They would say that people could invest their money in inexpensive healthcare or cheap, nutritional food and save small portions for the future, rather than buy the more expensive healthcare and food upfront because they will continue to be stuck in the poverty trap.

I felt that although it was a well thought out example, I would have liked to have more information on the Feud. They present the data as if it was just one experiment, which may or may not be the case. If they had presented a series of trials to the reader than it would provide the article with more credibility. In addition, I feel that the presence of another game or experiment, like the Feud, where people are faced with making decisions in the presence of scarcity would further strengthen the view that they are trying to portray.

Assignment #1 Spring 2013

To me, blogging is a way for people to communicate and express their ideas, feelings, and interests in an open forum.

Blogs are different from other types of writing, as they don’t always try to convey or prove a central thesis statement. Blogging often provokes responses and stimulates conversation amongst a variety of bloggers who are interested in the subject being discussed in the blog. Many economic based minds will use blogs to report current events or issues and then deliver their opinion on the implications that the event/issue will have on the economy.


Obama Picks Morgan Stanley’s Lawyer to Lead SEC:

http://www.bloomberg.com/news/2013-01-24/obama-picks-morgan-stanley-s-laywer-to-lead-sec.html

That claim that students whose parents pay for more of college get worse grades:

http://www.statsblogs.com/2013/01/22/that-claim-that-students-whose-parents-pay-for-more-of-college-get-worse-grades/

Econometrics vs. Statistics:

http://www.information-management.com/blogs/econometrics-BI-statistics-analytics-10021439-1.html

Of these articles, the authors of the first two are frequent bloggers, blogging once daily, while the author of the last article blogs much less frequently. The first author questions the appointment of his subject, Mary Jo White, to the chairman of the Securities and Exchange Commission. He draws on history in order to develop and convey his stance on the issue. The second author uses their blog to address the issue of “The more money that parents provide for higher education, the lower the grades their children earn.”. The final author utilizes comparison techniques to examine the benefits and downfalls of statistics and econometrics.

I especially enjoy reading blogs like “Obama Picks Morgan Stanley’s Lawyer to Lead SEC”. These types of articles have the ability to spark debate that helps enhance people’s knowledge of the involved issues.